

Hello! Welcome to this quick and dirty page. I threw this together to house a couple of images and links that I hope you will find enlightening.
A few days ago I was telling my friends and family to buy Bitcoin. Now I am in an alternate universe where I understand with complete clarity how I, and everyone in crypto, was just “fleeced” *(in the words of Richard Wyckoff)
Look at the images below and PLEASE read this article where I “borrowed” the descriptions: https://school.stockcharts.com/doku.php?id=market_analysis:the_wyckoff_method
I tried to share this information and images with people in the crypto space, sending direct emails to some of my favorite crypto youtubers. I never heard back from any of them. So, I posted my own video on April 25, 2021:
Wyckoff’s “Composite Man”
Wyckoff proposed a heuristic device to help understand price movements in individual stocks and the market as a whole, which he dubbed the “Composite Man.”
“…all the fluctuations in the market and in all the various stocks should be studied as if they were the result of one man’s operations. Let us call him the Composite Man, who, in theory, sits behind the scenes and manipulates the stocks to your disadvantage if you do not understand the game as he plays it; and to your great profit if you do understand it.” (The Richard D. Wyckoff Course in Stock Market Science and Technique, section 9, p. 1-2)
Wyckoff advised retail traders to try to play the market game as the Composite Man played it. In fact, he even claimed that it doesn’t matter if market moves “are real or artificial; that is, the result of actual buying and selling by the public and bona fide investors or artificial buying and selling by larger operators.” (The Richard D. Wyckoff Method of Trading and Investing in Stocks, section 9M, p. 2)
Based on his years of observations of the market activities of large operators, Wyckoff taught that:
- The Composite Man carefully plans, executes and concludes his campaigns.
- The Composite Man attracts the public to buy a stock in which he has already accumulated a sizeable line of shares by making many transactions involving a large number of shares, in effect advertising his stock by creating the appearance of a “broad market.”
- One must study individual stock charts with the purpose of judging the behavior of the stock and the motives of those large operators who dominate it.
- With study and practice, one can acquire the ability to interpret the motives behind the action that a chart portrays. Wyckoff and his associates believed that if one could understand the market behavior of the Composite Man, one could identify many trading and investment opportunities early enough to profit from them.
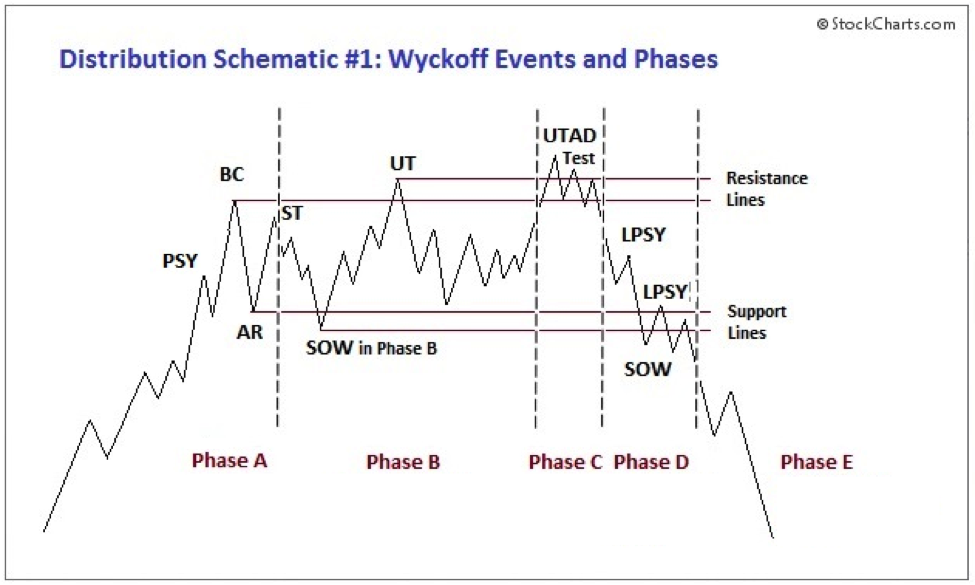
PSY—preliminary supply, where large interests begin to unload shares in quantity after a pronounced up-move. Volume expands and price spread widens, signaling that a change in trend may be approaching.
BC—buying climax, during which there are often marked increases in volume and price spread. The force of buying reaches a climax, with heavy or urgent buying by the public being filled by professional interests at prices near a top. A BC often coincides with a great earnings report or other good news, since the large operators require huge demand from the public to sell their shares without depressing the stock price.
AR—automatic reaction. With intense buying substantially diminished after the BC and heavy supply continuing, an AR takes place. The low of this selloff helps define the lower boundary of the distribution TR.
ST—secondary test, in which price revisits the area of the BC to test the demand/supply balance at these price levels. For a top to be confirmed, supply must outweigh demand; volume and spread should thus decrease as price approaches the resistance area of the BC. An ST may take the form of an upthrust (UT), in which price moves above the resistance represented by the BC and possibly other STs before quickly reversing to close below resistance. After a UT, price often tests the lower boundary of the TR.
SOW—sign of weakness, observable as a down-move to (or slightly past) the lower boundary of the TR, usually occurring on increased spread and volume. The AR and the initial SOW(s) indicate a change of character in the price action of the stock: supply is now dominant.
LPSY—last point of supply. After testing support on a SOW, a feeble rally on narrow spread shows that the market is having considerable difficulty advancing. This inability to rally may be due to weak demand, substantial supply or both. LPSYs represent exhaustion of demand and the last waves of large operators’ distribution before markdown begins in earnest.
UTAD—upthrust after distribution. A UTAD is the distributional counterpart to the spring and terminal shakeout in the accumulation TR. It occurs in the latter stages of the TR and provides a definitive test of new demand after a breakout above TR resistance. Analogous to springs and shakeouts, a UTAD is not a required structural element: the TR in Distribution Schematic #1 contains a UTAD, while the TR in Distribution Schematic #2 does not.
Distribution: Wyckoff Phases
Phase A: Phase A in a distribution TR marks the stopping of the prior uptrend. Up to this point, demand has been dominant and the first significant evidence of supply entering the market is provided by preliminary supply (PSY) and the buying climax (BC). These events are usually followed by an automatic reaction (AR) and a secondary test (ST) of the BC, often upon diminished volume. However, the uptrend may also terminate without climactic action, instead demonstrating exhaustion of demand with decreasing spread and volume; less upward progress is made on each rally before significant supply emerges.
In a redistribution TR within a larger downtrend, Phase A may look more like the start of an accumulation TR (e.g., with climactic price and volume action to the downside). However, Phases B through E of a re-distribution TR can be analyzed in a similar manner to the distribution TR at the market top.
Phase B: The function of Phase B is to build a cause in preparation for a new downtrend. During this time, institutions and large professional interests are disposing of their long inventory and initiating short positions in anticipation of the next markdown. The points about Phase B in distribution are similar to those made for Phase B in accumulation, except that the large interests are net sellers of shares as the TR evolves, with the goal of exhausting as much of the remaining demand as possible. This process leaves clues that the supply/demand balance has tilted toward supply instead of demand. For instance, SOWs are usually accompanied by significantly increased spread and volume to the downside.
Phase C: In distribution, Phase C may reveal itself via an upthrust (UT) or UTAD. As noted above, a UT is the opposite of a spring. It is a price move above TR resistance that quickly reverses and closes in the TR. This is a test of the remaining demand. It is also a bull trap—it appears to signal the resumption of the uptrend but in reality is intended to “wrong-foot” uninformed break-out traders. A UT or UTAD allows large interests to mislead the public about the future trend direction and, subsequently, sell additional shares at elevated prices to such break-out traders and investors before the markdown begins. In addition, a UTAD may induce smaller traders in short positions to cover and surrender their shares to the larger interests who have engineered this move.
Aggressive traders may wish to initiate short positions after a UT or UTAD. The risk/reward ratio is often quite favorable. However, the “smart money” repeatedly stops out traders who initiate such short positions with one UT after another, so it is often safer to wait until Phase D and an LPSY.
Often demand is so weak in a distribution TR that price does not reach the level of the BC or initial ST. In this case, Phase C’s test of demand may be represented by a UT of a lower high within the TR.
Phase D: Phase D arrives after the tests in Phase C show us the last gasps of demand. During Phase D, price travels to or through TR support. The evidence that supply is clearly dominant increases either with a clear break of support or with a decline below the mid-point of the TR after a UT or UTAD. There are often multiple weak rallies within Phase D; these LPSYs represent excellent opportunities to initiate or add to profitable short positions. Anyone still in a long position during Phase D is asking for trouble.
Phase E: Phase E depicts the unfolding of the downtrend; the stock leaves the TR and supply is in control. Once TR support is broken on a major SOW, this breakdown is often tested with a rally that fails at or near support. This also represents a high-probability opportunity to sell short. Subsequent rallies during the markdown are usually feeble. Traders who have taken short positions can trail their stops as price declines. After a significant down-move, climactic action may signal the beginning of a re-distribution TR or of accumulation.
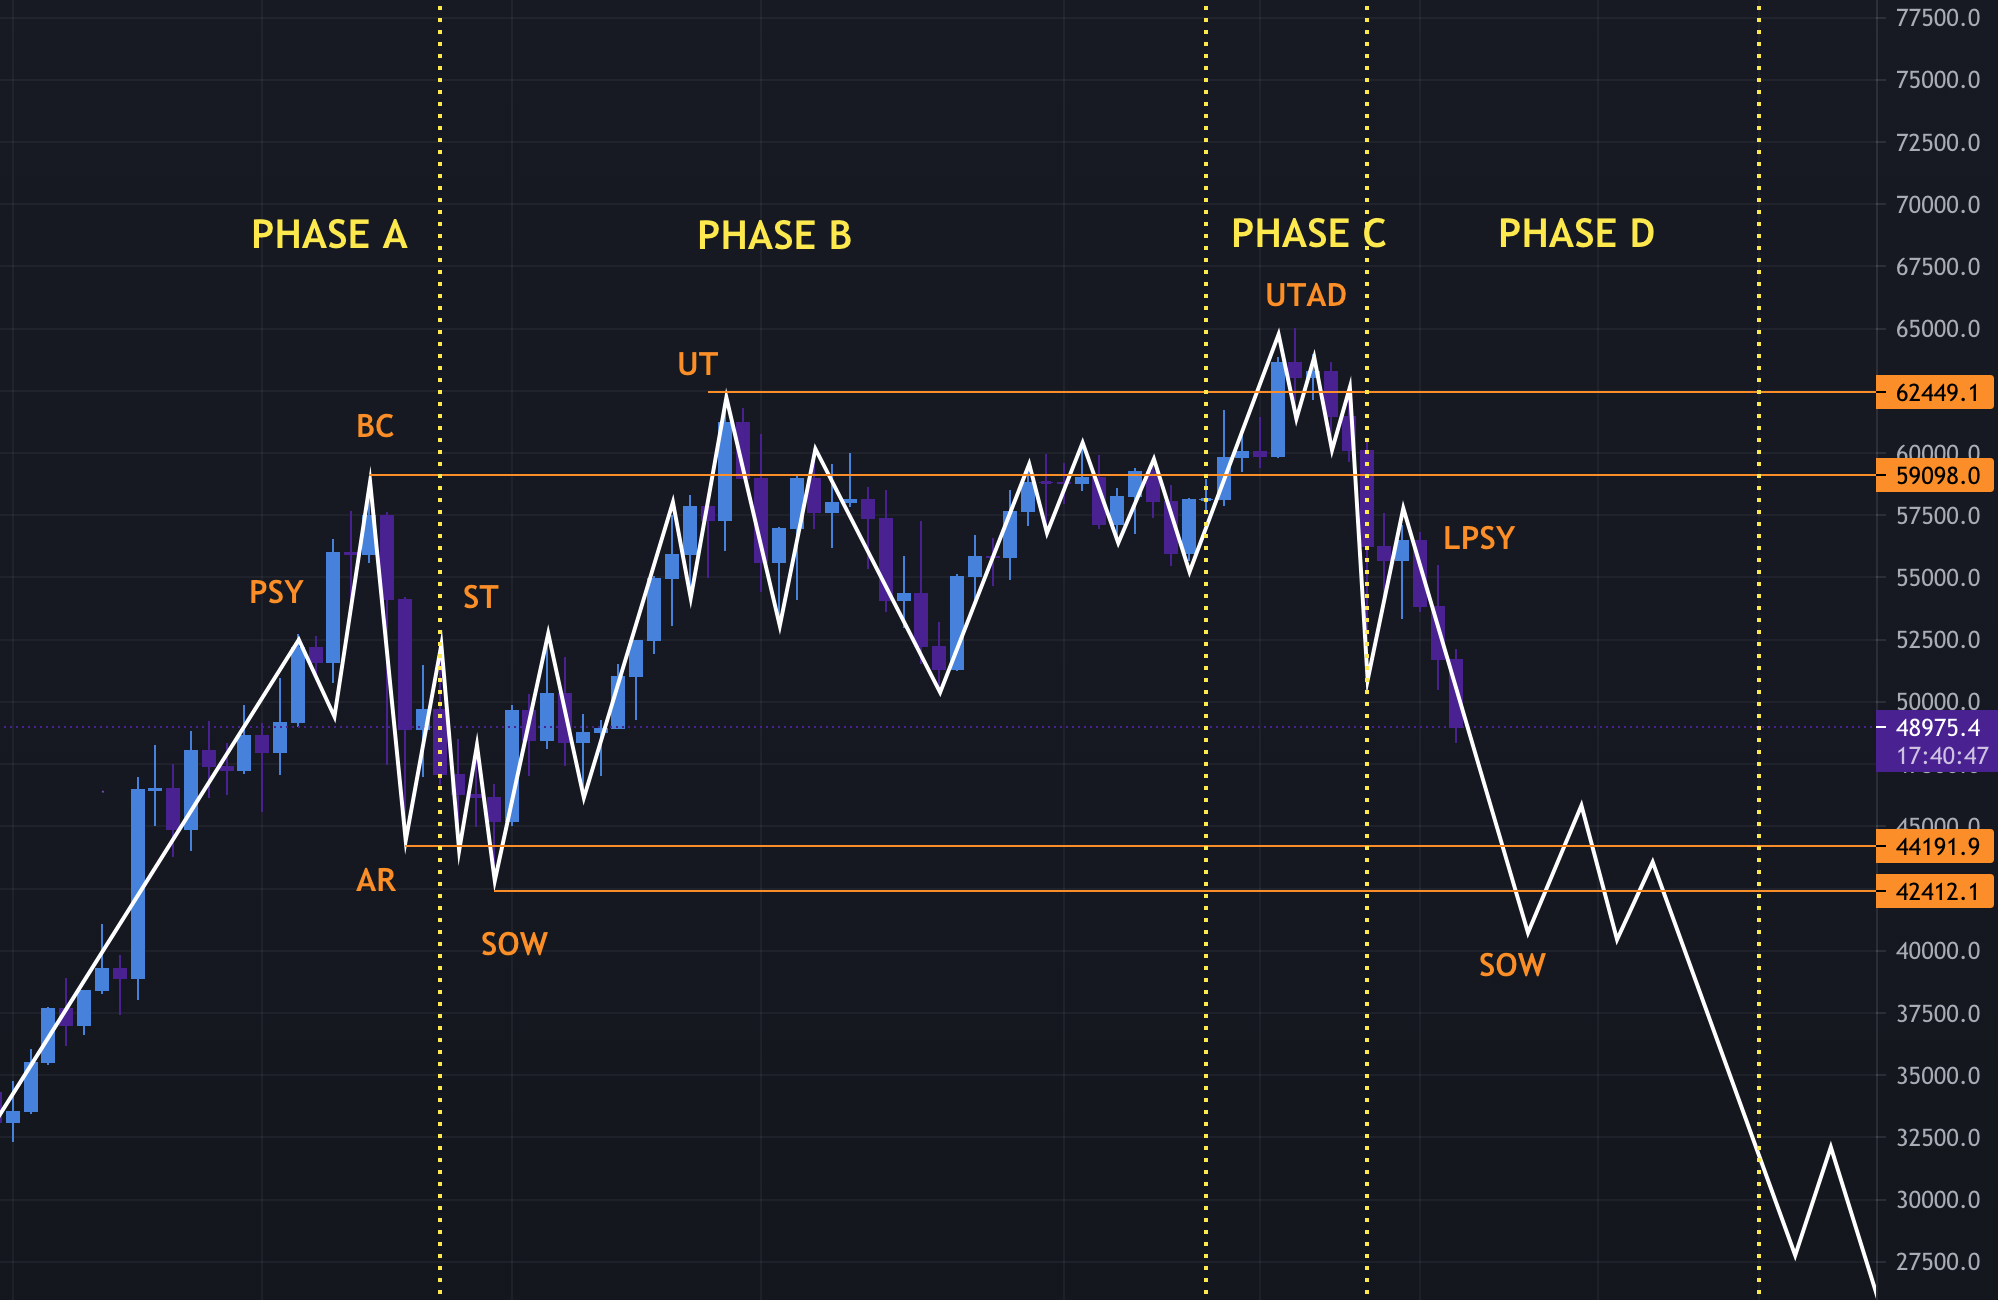
Crypto Traders: Smarten Up
It’s not just the little guys anymore… the big players are here and BTC is, sadly, now a market like anything else. Be safe out there. Cheers.
Hello and thanks for this great analysis! I watched your Youtube Video several times. Last week, I’d thought it wouldn’t play, but as yesterday’s events occurred, your analysis is fully playing out. Great work, much appreciated. As I was selling most all of my Bitcoin on the way these kind of “corrections” mostly hurt my altcoin portfolio but I noticed that they still stay strong but I am aware to sell them if your analysis plays out. By now I’am expecting som kind of relief rallye until 50.5k for BTC, maybe higher to give retail investors the imagination this correction is but I still see the potential to hit the 20k level, as phase E is getting to work out. Many thanks again and best wishes from Berlin in Germany! Erik
Great work Captain
Any updates on shorter time frames we could learn a lot cheers
Thanks
Elon Tweets vs. Wyckoff Distribution
https://www.tradingview.com/chart/BTCUSD/WynFtv30-Elon-Musk-Wyckoff-Chart/
Great post. Thank you for sharing this with the world.
This analysis is amazing, I like it. I am Johnny from Bybit business development team, I would like to have a chat with you for collaboration.
Hi – Really enjoy all your videos, thanks for putting all this info together and being such a well-reasoned individual. For someone who is just starting out and wants to better understand TA, what resources and tools do you recommend me starting out with and then from there, progressing. Thanks, much appreciated!
Hi Ryan, my wife and I first saw you on the “Bit Boy” stream. You very much appear to be a man with good measures and balance of belief, integrity, grounding and heart. Definitely a person that I would like to align myself with and learn from. Thank you for your research, time and effort in this space that is becoming overwhelmed with so much hype and noise. What you are sharing is and will continue to be valued by many. Remain humble and be encouraged!
Thank you very much for sharing this, it really opened my eyes. I don’t know if you noticed, but at the time of this writing (5/28/2021) it appears the 7 day chart pattern for BTC looks very similar to the 3 month pattern. Almost as if Wyckoff is playing out again but in a much shorter time frame. Using your analogy from youtube, it’s kind of like the whales left a calling card within a calling card with the recent Bitcoin action.
Hi! I’m at work browsing your blog from my new iphone!
Just wanted to say I love reading through your
blog and look forward to all your posts! Carry on the superb work!
Hi Ryan, Hope you are well and recovering from Crypto-disillusion. I went through the same emotional detour – excitement over the possibilities that crypto offer. Followed by the realisation it is a manipulated market like all others – now focusing on the technology and not the price action. However, I am making contact for something you said on your latest YouTube video. You mentioned you founded a business allowing communities to utilise their resources in the best way. I am working with some friends on a similar idea for our community (not as a business but a community resource). We recognise that our community has huge unlocked potential (retired professionals, talented home bound mothers, energised millennials…) and we would like to provide a solution as to how to bring that potential to fruition. It would be great to touch base and discuss the solutions you have been working on. I understand I am a stranger cold-calling, so feel free to ignore this but if you find some time drop me a message. Appreciate your input to the world and hope your ideas, beliefs and attitude continue to spread for all the right reasons. All the best, Nick
Amazing! Its really awesome paragraph, I have
got much clear idea about from this article.
No reply from YouTubers is because they are mostly part of the Institution that we speak of. You can see how they talk, compose their shows as purely entertainment, mind conditioning techniques. They earn from follows likes, and pump and dumps as well as maybe some institution perks.
Anyway, this is a great share and this was taught in trading class. This is will help a lot of retailers, especially those pensions that are intended to make life better during retirement.
Let’s keep on informing the community about the equal distribution of wealth! TWO THUMBS UP!